(TX_TB) Proportion of ART patients screened for TB in the semiannual reporting period who start TB treatment
Export Indicator
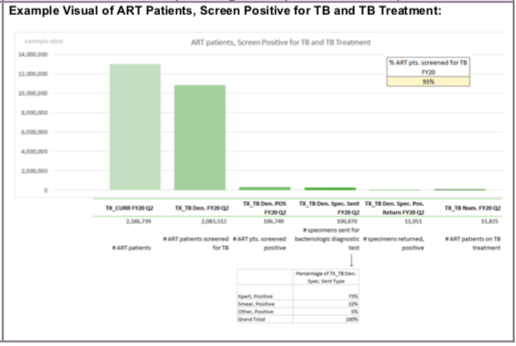
This indicator documents the TB screening of ART patients as well as the proportion who were diagnosed and started on TB therapy. The disaggregates demonstrate the cascade from screening to testing and can be used to identify gaps and challenges in TB diagnostic activities.
Number of ART patients who were started on TB treatment during the semiannual reporting period
Number of ART patients who were screened for TB at least once during the semiannual reporting period
How to calculate annual total:
TX_TB Denominator is a snapshot indicator (i.e., the APR calculation = Q4) because it is intended to capture a clinical event (screening), and not unique patients. This is why TX_TB Denominator should be compared to TX_CURR, another snapshot indicator. Note that the TX_TB Numerator, if analyzed on its own, could be summed across semiannual time periods to conclude the number of ART patients who were started on TB treatment during the fiscal year.
How to collect:
The denominator can be generated by counting the number of ART patients who were screened for TB symptoms at least once during the reporting period. This includes newly enrolling ART patients as well as those previously started on ART.
The numerator can be generated by counting the number of ART patients screened for TB who were diagnosed with TB and started on anti-TB therapy during the reporting period. These data should be captured in ART registers as well as additional data collection sources (e.g., facility-based TB screening registers or forms, TB specimen registers, TB microscopy result registers, GeneXpert data collection systems) that may contain relevant information (e.g., TB screening results, TB specimen testing results). Programs should modify the register as needed to easily capture this information.
Documentation of symptom screening is generally collected in patient charts but may also be collected in another aggregate partner-generated data source.
Screening for TB and/or initiation of anti-TB therapy might not happen at the same time that ART is started. For PLHIV new to HIV care, those who are diagnosed with TB are usually started on anti-TB therapy before they initiate ART (e.g., 2-8 weeks as per current recommendations). Regardless of when they occur relative to ART initiation, TB screening and initiation of TB therapy should be included for all patients who were currently on ART or who started ART at any time during the reporting period.
Further information on how to use and collect these data is provided by WHO in the following guidelines: “Latent Tuberculosis Infection: Updated and Consolidated Guidelines for Programmatic Management.”
Reporting level: Facility
How to review for data quality:
Only one disaggregation type is used for age (coarse disaggregates). Numerator ≥ subtotal of each of the disaggregations.
Reporting frequency: Semi-Annually
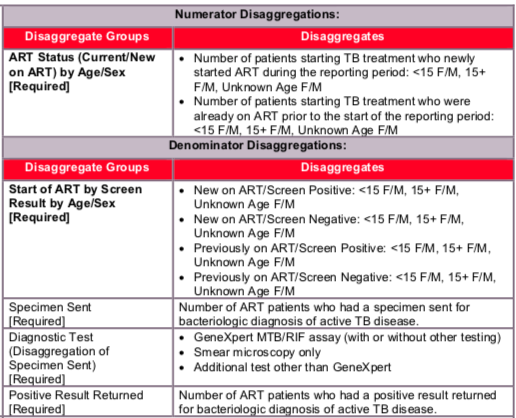
- Age/Sex/New on ART/Screen Positive: The number of patients who started ART in the reporting period and who screened with least one positive symptom during the reporting period.
- Age/Sex/New on ART/Screen Negative: The number of ART patients who started ART in the reporting period and who had all negative symptom screens during the reporting period.
- Age/Sex/Previously on ART/Screen Positive: The number of patients who were on ART prior to the reporting period and who had at least one positive symptom screen during the reporting period.
- Age/Sex/Previously on ART/Screen Negative: The number of ART patients who were on ART prior to the reporting period and who had all negative symptom screens during the reporting period.
The numerator can be generated by counting the number of screened ART patients who were diagnosed with TB and started on anti-TB therapy during the reporting period
The denominator can be generated by counting the number of ART patients who were screened for TB symptoms at least once during the reporting period
Indicator changes (MER 2.0 v2.3 to v2.4): None
Standard definition of DSD and TA-SDI used.
Provision of key staff or commodities for routine HIV-related services includes: ongoing provision of critical re-occurring costs or commodities (such as ARVs, TB preventive therapy and diagnostic/screening tests) or funding of salaries or provision of Health Care Workers for HIV clinic services. Staff responsible for maintaining patient records in both HIV and TB clinics are included in this category however staff responsible for fulfilling reporting and routine M&E requirements are not included.
Ongoing support for patients receiving routine HIV-related services includes: training of HIV service providers, clinical mentoring and supportive supervision of staff at HIV sites, infrastructure/renovation of facilities, support of HIV service data collection, reporting, data quality, QI/QA of HIV services support, ARV and IPT consumption forecasting and supply management, support of lab clinical.
- If the denominator does not roughly equal TX_CURR, please describe the main reasons.
- If there are issues with reporting the disaggregations, please describe.
- If there are issues with performance (e.g., if specimens are not sent for all persons who screened positive for TB symptoms, or if the numerator doesn’t equal positive specimen returned), what are they and how can they be addressed?
- Are the patients in the numerator all receiving care from PEPFAR-supported sites? Are they receiving TB and HIV care from the same site?
- Describe access to GeneXpert testing for ART patients who screen positive for TB.